


05 Jun Ambulance Service Ecosystem: Understanding the System You Have

Photo by Carlos Alfonso on Unsplash
Austin, Texas, is now the 10th largest city in the United States. One hundred sixteen net new people move here every day. Imagine a domestic, commercial flight pulling into gate 10 at Austin’s International Airport, and most of the passengers stay for good. Everyday.
What does this steady infusion of people mean for healthcare? It means the system you had last year doesn’t fit. The system you require next year and into the future is not the one you have right now. How do leaders understand their current situation in order to inform thinking about where design or redesign is required for the future?
Dr. José Colucci faced that exact question. As the lead of R&D at the Design Institute for Health, formerly part of the Dell Medical School at the University of Texas at Austin, Colucci spoke with healthcare leaders intending to understand the local health ecosystem better. He quickly learned people had difficulty describing the community’s health system. Individually, each leader held deep expertise in their part of the system, but pan out, and their appreciation of the whole system and how it worked was less precise.
This phenomenon is true of local ambulance systems. Community leaders and ambulance leaders typically hold rich knowledge and a detailed understanding of their parts of the system, but they don’t share a method for seeing the whole system. Query databases of published research or search Google for a method, and you will not find a best practice or published tool.
How did Dr. Colucci approach this challenge? How can community and ambulance leaders learn from his efforts? Dr. Colucci introduced systems thinking and led local leaders to visualize the healthcare ecosystem.
What would this approach look like for appreciating an EMS system? Here are a few learning steps: (1) define the boundary, (2) appreciate the population, (3) recognize the sources of funding and (4) health insurance coverage, (5) understand the current demand, and (6) identify the people and organizations available to deliver services. Finally, gather the data and make it visible for learning. Below, each step is described.
(Author’s Note: The use of Austin, Texas, to illustrate the method is based only on convenience. The Health Ecosystem work occurred here, and many data sources are publicly accessible.)
Step 1: Define the Boundary
Every system is defined by its boundaries. Is this the city limits, a county line, or another defining border? The EMS system is not the same as the emergency ambulance provider. For example, in Austin, the system is bound by the border of Travis County.
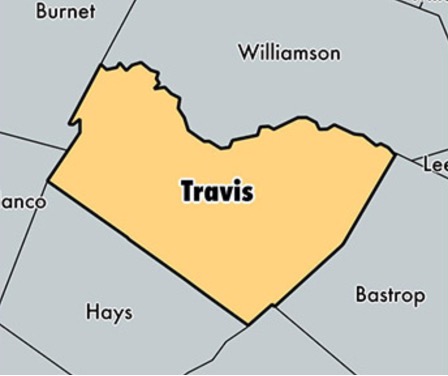
Boundaries: Travis County, Texas, USA
Within the boundaries of the EMS system are multiple people and organizations that provide services to meet the needs of the community and patients. Learning about them is coming, but it can be helpful to continue to learn about the system first.
Step 2: Appreciate the Population
What is the total population served by the system? Start with the residents living within the boundary but consider people commuting in from bordering communities and visitors. It’s difficult to appreciate a system without appreciating the population whose needs it intends to serve. This is your starting number.
What do you know about the population? Many communities employ local demographers who study breakdowns of census data used in forecasting and planning. Here is an excellent example from the City of Austin. Standard variables include age, sex, income level, race, languages, employment, location, homeownership, and level of education. People share similarities, and we have differences to consider when designing and operating a system.
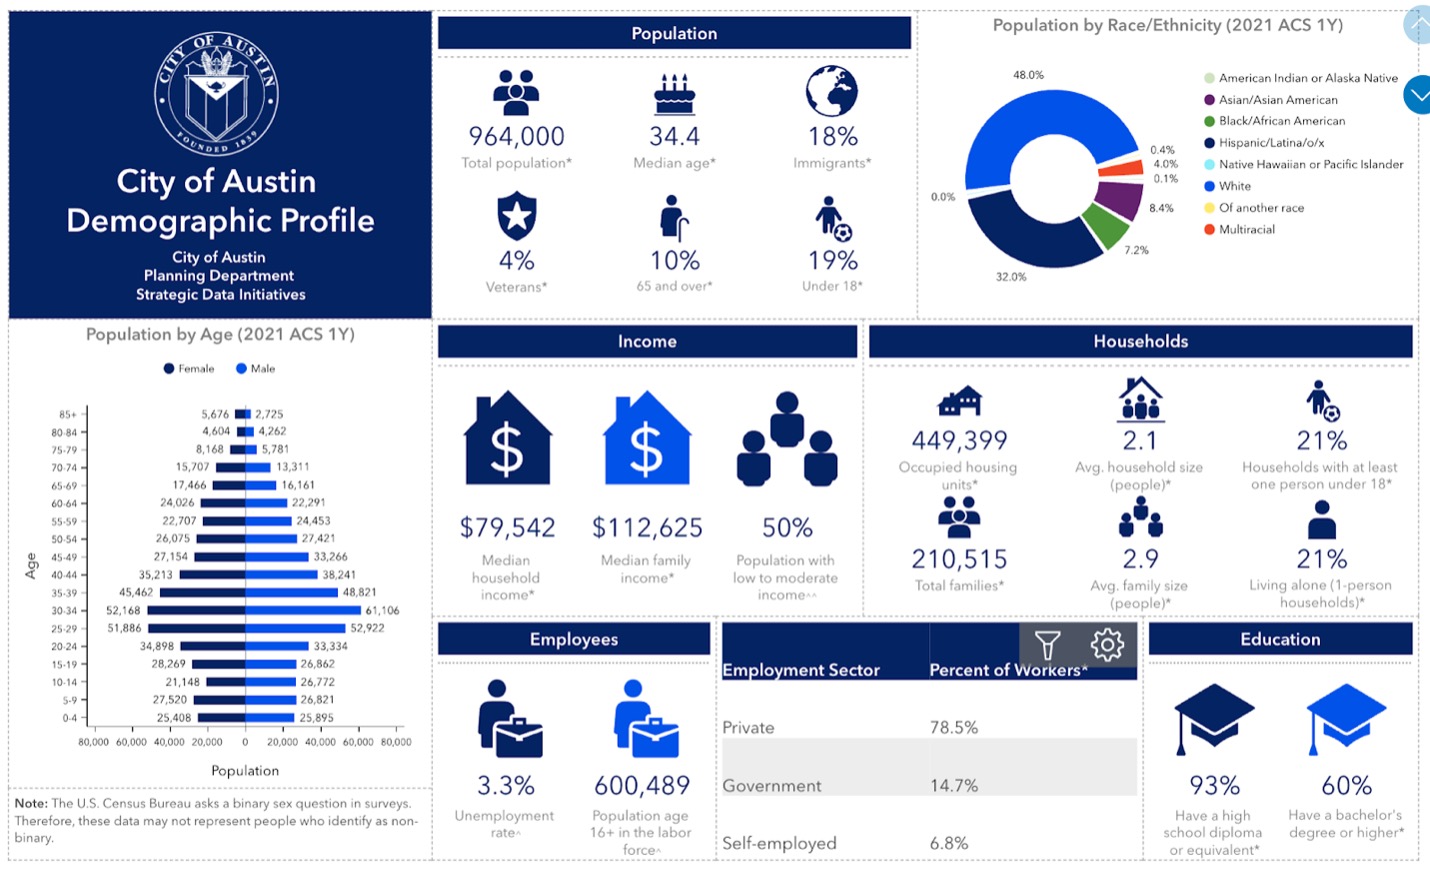
Understanding the population provides valuable insights into the people in the community and important segments to consider in the system’s design and operation. Understanding your population also helps leaders predict what is required for future changes and planning.
STEP 3: Funding Sources
How do we pay for the system? What are the current sources of funding? Taxes, grants, fees, insurance, etc. How much is the current local tax funding? What grants add support, and by how much? Are they available for broad use or linked to specific programs? What is the contribution from the users of the services (transport fees and insurance reimbursement)? What fees are collected (e.g., special events, training, medical records)?
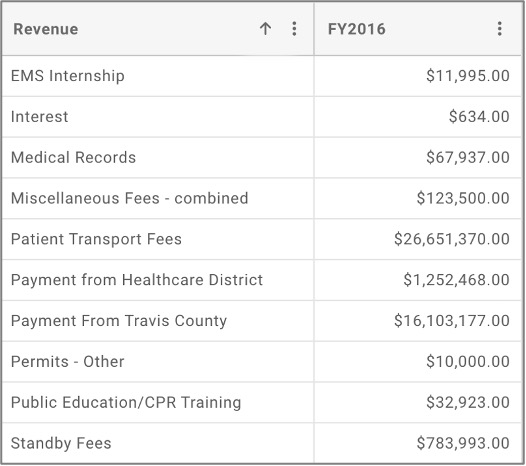
Example of Revenue Sources in Addition to Local Tax Subsidy
(Source: City of Austin, FY2016)
Understanding the mix and amounts of all funding sources provides an awareness of how the system is paid for. It also aids prediction of the effects when leaders or their funders make changes. For example, what happens if significant grants for disaster preparedness are no longer available? What if community leaders were to ask all departments to cut tax-funded budgets by 5 to 10 percent? What if another organization was awarded the event or training contracts?
STEP 4: Health Insurance Coverage
Health insurance is a significant factor in system funding in the United States and other counties. Insurance may pay all or part of the ambulance care or transport charges. What are the sources of healthcare coverage in the system?

Infographic of Travis County Population Payor Sources
(Source: Design Institute of Health)
How many people are covered by each type? How many people have private insurance like employee-based, direct purchase, marketplace, or TRICARE? How many have public coverage like Medicare, Medicaid, or Veterans Affairs?
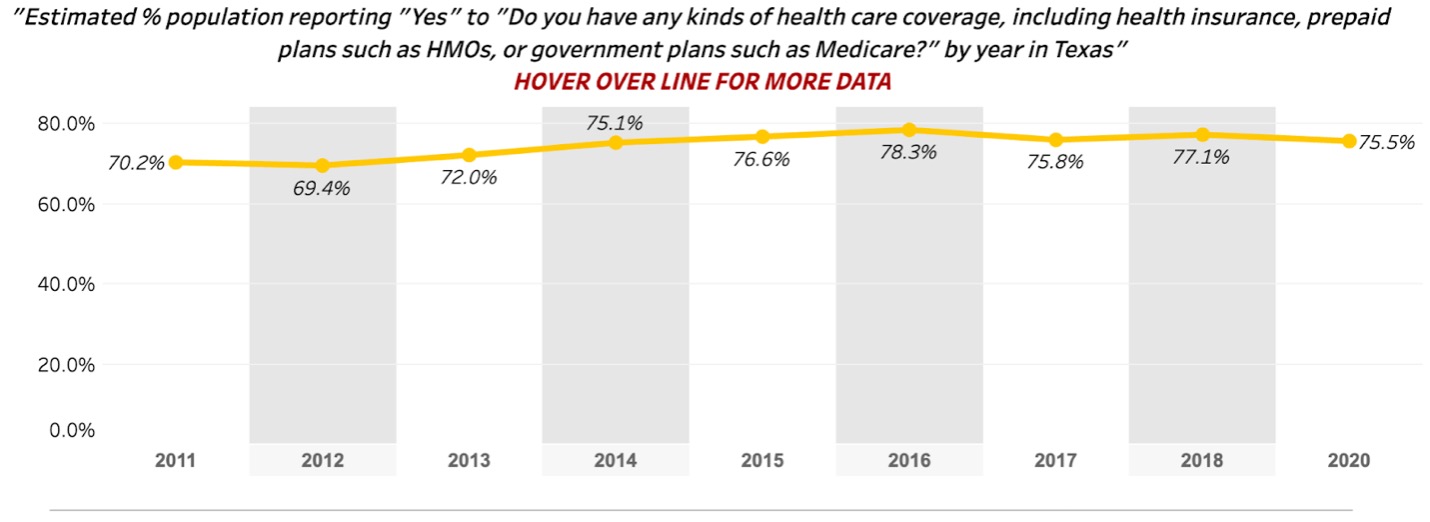
Texas Behavioral Risk Factor Surveillance System
(Source)
How many people have no coverage and pay out of pocket or not at all? How are shifts in the population over time affecting the mix of these sources? How would revenue change if all payors standardized their reimbursement to match Medicaid or Medicare rates? What if your state expands Medicaid access? What if payors stopped reimbursing non-medically necessary transports?
STEP 5: Understand the Current Demand
Why do people access the system? Information from emergency and non-emergency call centers offers insights into the direct aid requests that come into the system. Products like the Medical Priority Dispatch System (MPDS) provide tools to summarize categories of calls and how the calls were distributed by triaged severity.
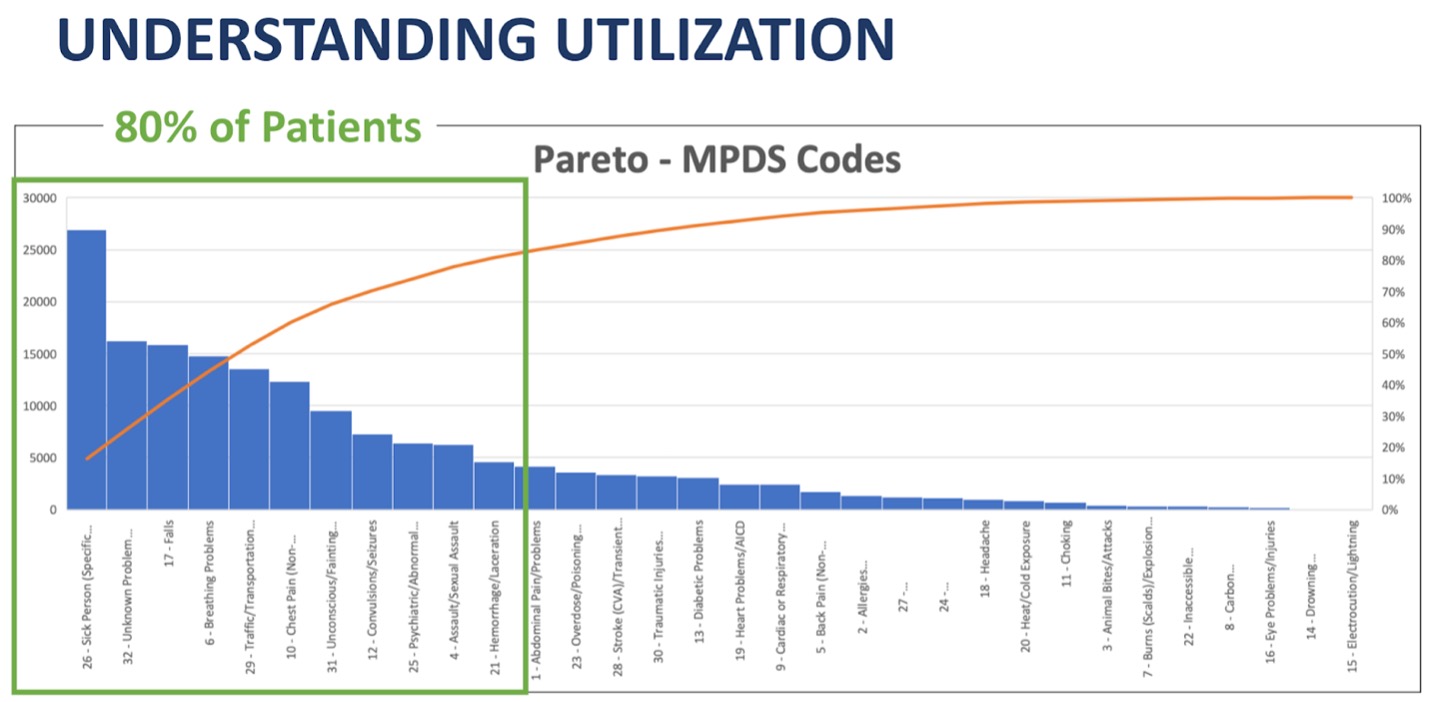
Pareto Chart of MPDS Protocols Ordered by Frequency
(Source: NAEMSP Keynote, 2021)
Also, consider indirect requests that come from partners. Law enforcement, other care providers, social services, and neighboring communities. These requests can reveal potential places new services or system changes may be helpful.
What does the demand for ambulance services look like outside the emergency system? This includes typical patient transportation between hospitals, skilled nursing, dialysis, and other healthcare-related services. Demand may also involve other medically related transportation, including wheelchairs and other people who require transportation for health needs.
Where else might medics be helpful to the community? This can include regular coverage like airports, industry, and school campuses. It might consist of everyday events like athletic game coverage to more variable large events like road races and festivals. Is there a need for skilled, mobile clinicians to serve the homeless population or support care in homes?
STEP 6: People and Organizations Available to Deliver Services
The last category is often the one leaders look at first–caregivers. Caregivers include people and organizations. I end here because the people and organizations are critical to serving the need, and the services provided should be designed to match the need.
People. How many certified or licensed individual providers are in your system? How many are actively practicing? Segment by types, including EMDs, first responders, EMTs, and paramedics. Many systems also have nurses, nurse practitioners, physician assistants, and physicians. Start with the raw data.
Later, you may want to understand their demographics (age, gender, ethnicity, etc.). Do your caregivers reflect the demographics of our community? How do you predict future staff needs based on our current staff mix?
What organizations provide services in the system? This can include community members, first responders, ambulance services, fire departments, companies, and volunteer organizations. Start by just gathering who they are. Later it can be helpful to map them in the system and link the population, call volume, and care providers to appreciate their role in the system. Often, organizations come, go, and change over time and have a history in the community. The organizational makeup is likely not by design. Are there gaps, overlaps, and redundancies?
Pulling it Together: Make the System Visible
Start by learning with the rough numbers. You will be more precise later. Sticky notes and whiteboards help depict the system visually and allow flexibility. Eventually, software helps make it prettier, more portable, and more accessible.
Here is a draft of Dr. Colucci’s display of the ecosystem of care in Travis County, Texas (Note: the EMS system was not captured as part of the health delivery system).
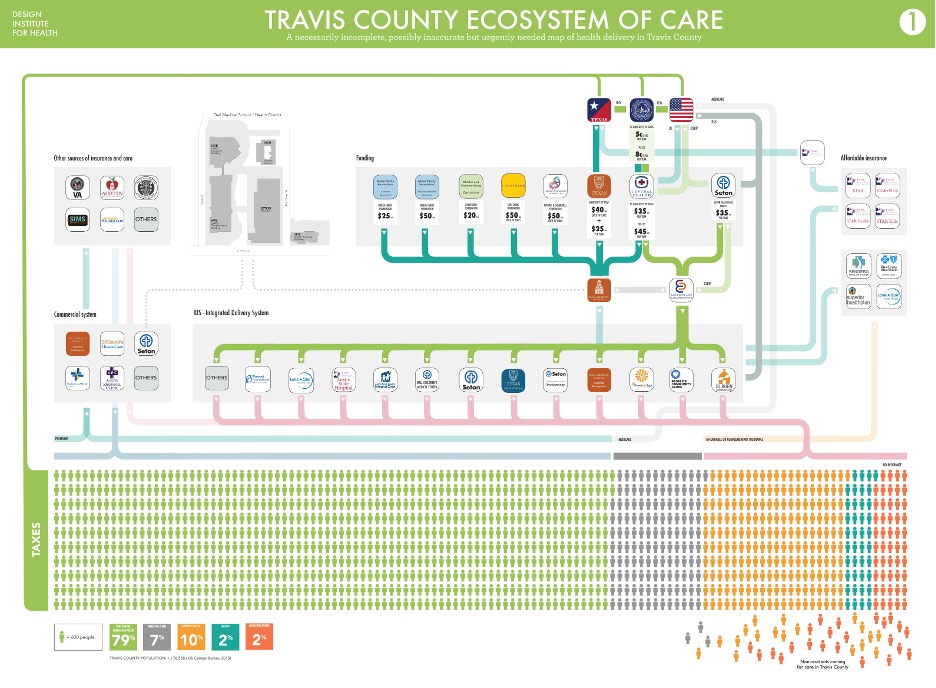
Draft Map of Travis County, Texas Ecosystem of Care
(Source: Poster from Dr. Jose Colucci)
SUMMARY: Where do you go from here?
Curious leaders with a learning mindset understand and see the activity’s utility in creating shared understanding, challenging operational definitions, and grappling with the variation in understanding across the team. However, typical resistance to the method includes thinking it is too elementary and already known or delays action.
Collecting and organizing the information is useful for learning by itself. It also supports reflecting on questions that stimulate new thinking and the need for change. I included example questions in each section. Here is a sample of questions the leaders find useful for learning and planning for design or redesign.
- How do the demographics of our caregivers match the demographics of the community served?
- How do we know every patient is getting equitable care and outcomes?
- How would the system look differently if the EMS system only transported patients who needed that level of care and transportation to an emergency department?
- What would revenue look like if payors only reimbursed care and transport requiring that service level?
- How will demand and funding change as varying generations age?
- How many people should be navigated to other services or served by new types of service?
- What if payors stopped reimbursing per transport or encounter?
- If most of the demand for service is non-emergent or urgent, what mix of caregivers best matches their care requirements?
- How could we improve the system if we had to reduce our budget by five percent per year?
There are many possible futures for a community’s ambulance system. Questions like these offer opportunities to think about change proactively. Gathering these data and making it visible helps leaders learn and make choices. Has your leadership team used a method like this before? If not, how could you try it? Start with one element, collect the data, and make it visible. What do you predict you might learn? Add over time. What further questions will emerge? Try it out and let me know.
—
David M. Williams, Ph.D., works with community and ambulance leaders globally to understand and improve EMS systems.
Connect on social media here. Sign up here to receive a regular email that includes all my blog posts and helpful resources I think you’d appreciate.